Portfolio interactive projects
A selection of projects I did in the past, for various clients, with different creative teams.
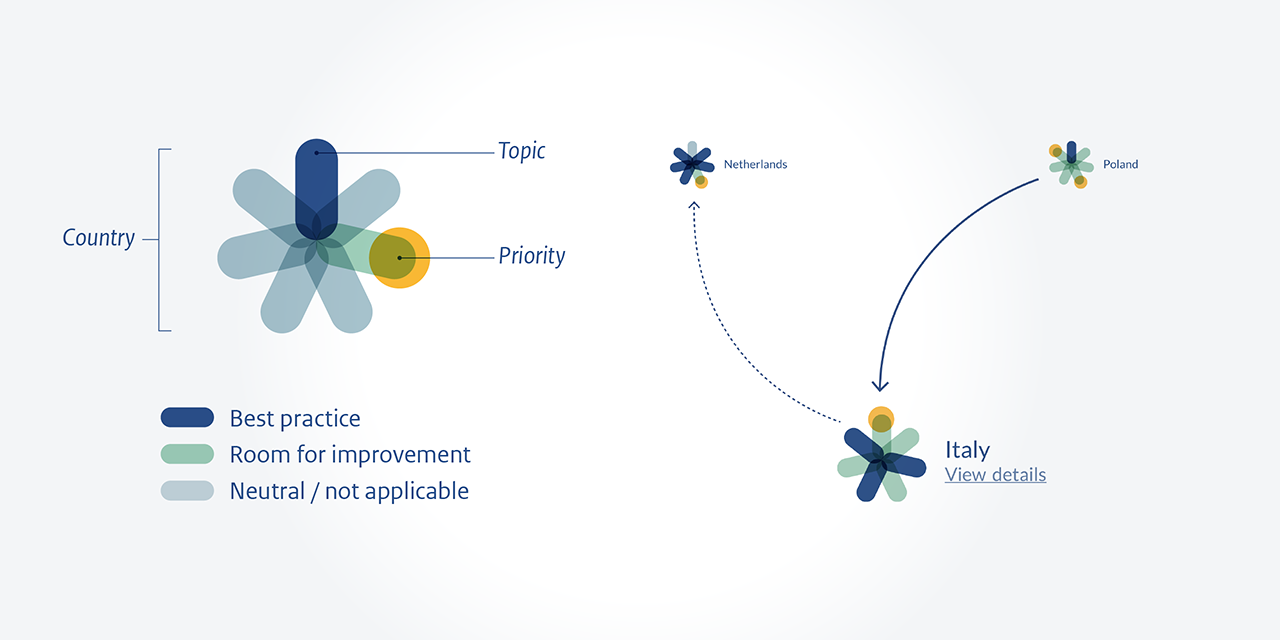
EU-JAMRAI
More than ever, we should be aware of the importance of a
joint approach on global health issues. This interactive
visualization shows the outcomes of country-to-country
peer review system on antimicrobial resistance.
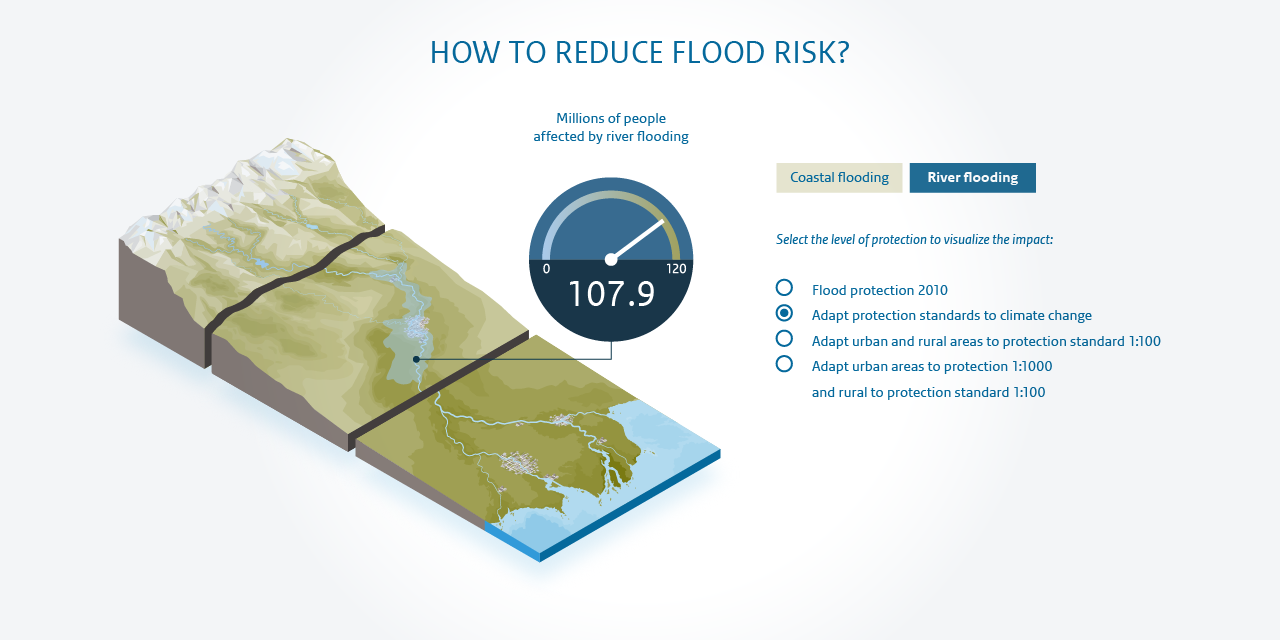
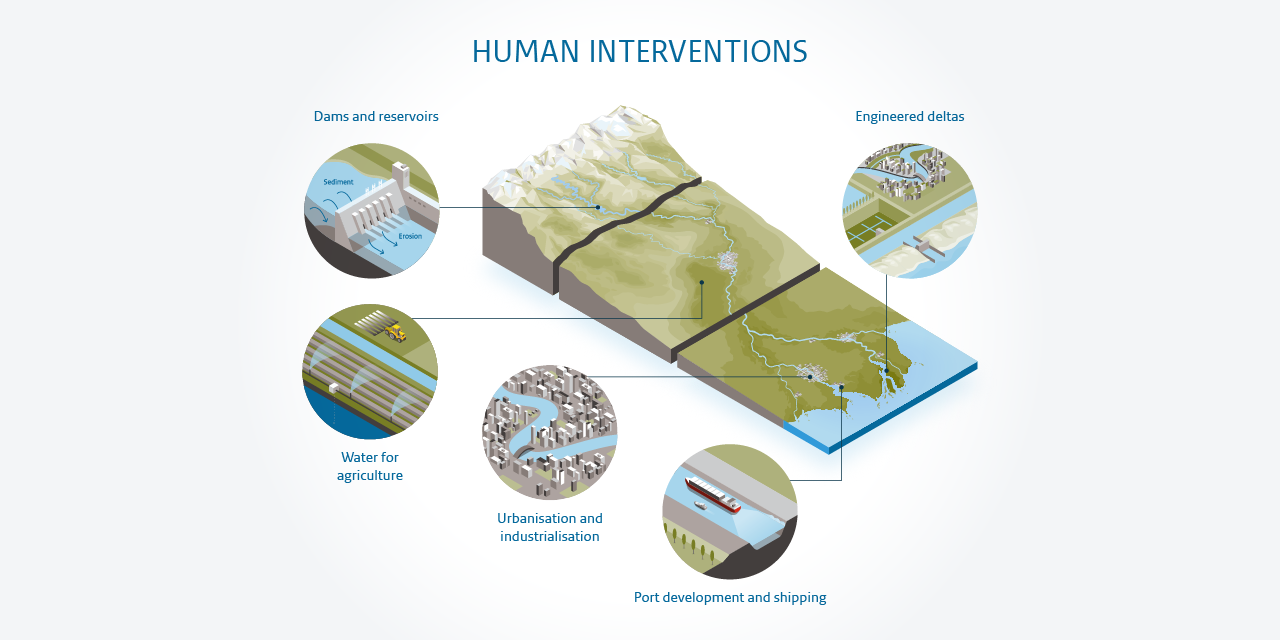
River Basin Delta Tool
This website –packed with interactive maps, charts and
infographics– shows how river and delta systems work under
different scenarios, and how we can bend the trend towards a
more sustainable future.
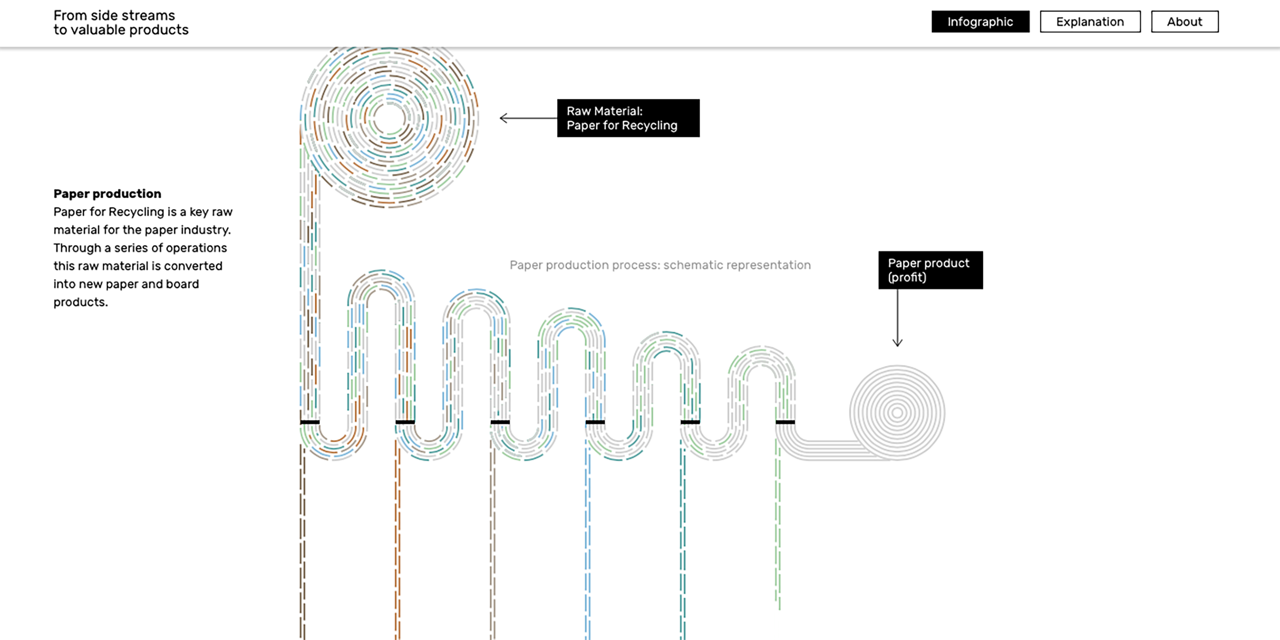
CEPI
Paper for Recycling is a key raw material for the paper
industry. Through a series of operations this raw
material is converted into new paper and board products.
This interactive application supports stakeholders in
the paper industry in becoming more sustainable.
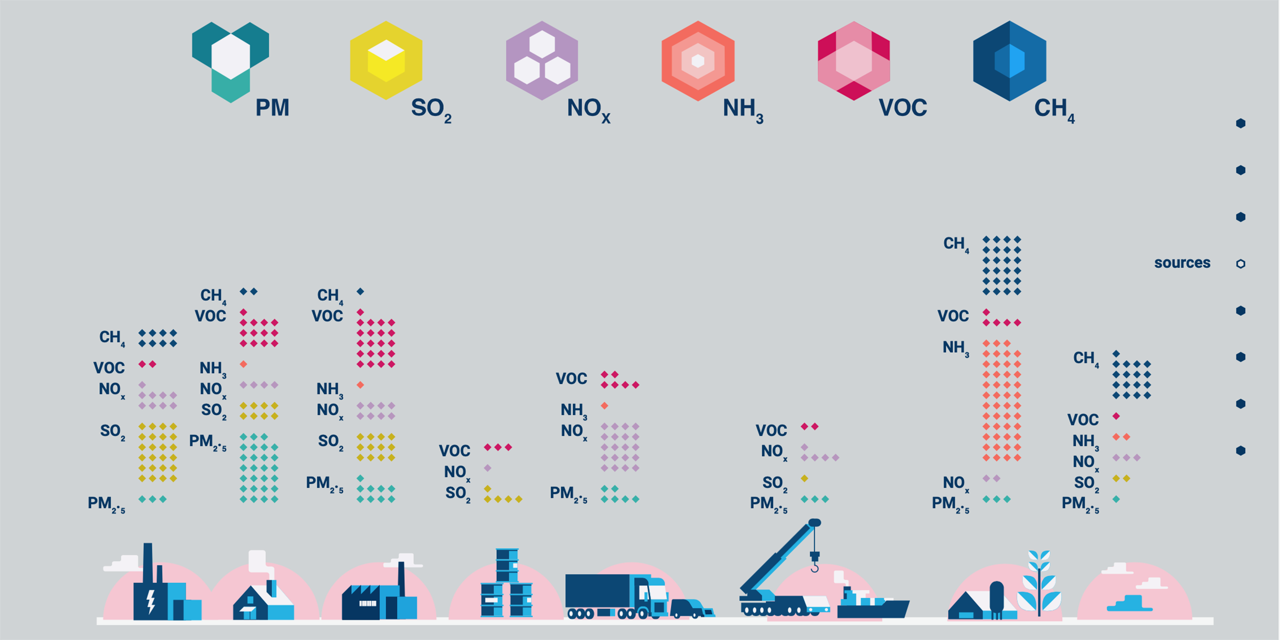
Cleaner air for all
This interactive visualisation show the European Commission
proposes to address air pollution in Europe.
Portfolio visualization projects
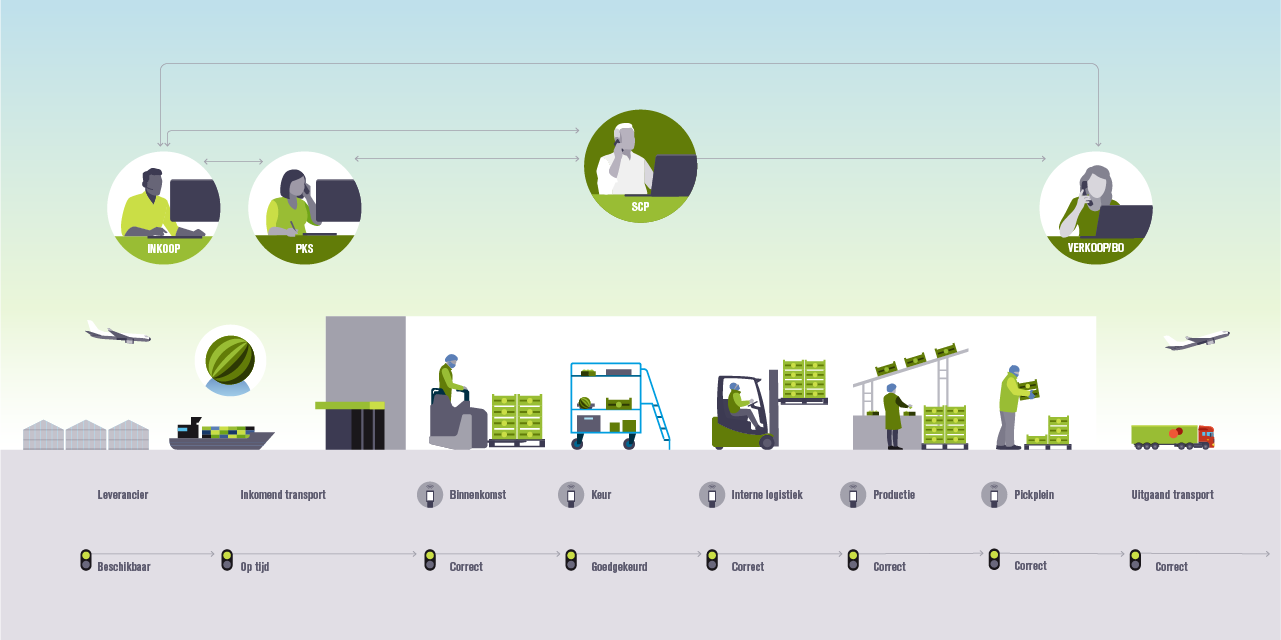
Anonymous client Process visualisation
Concept and design: Karin Schwandt
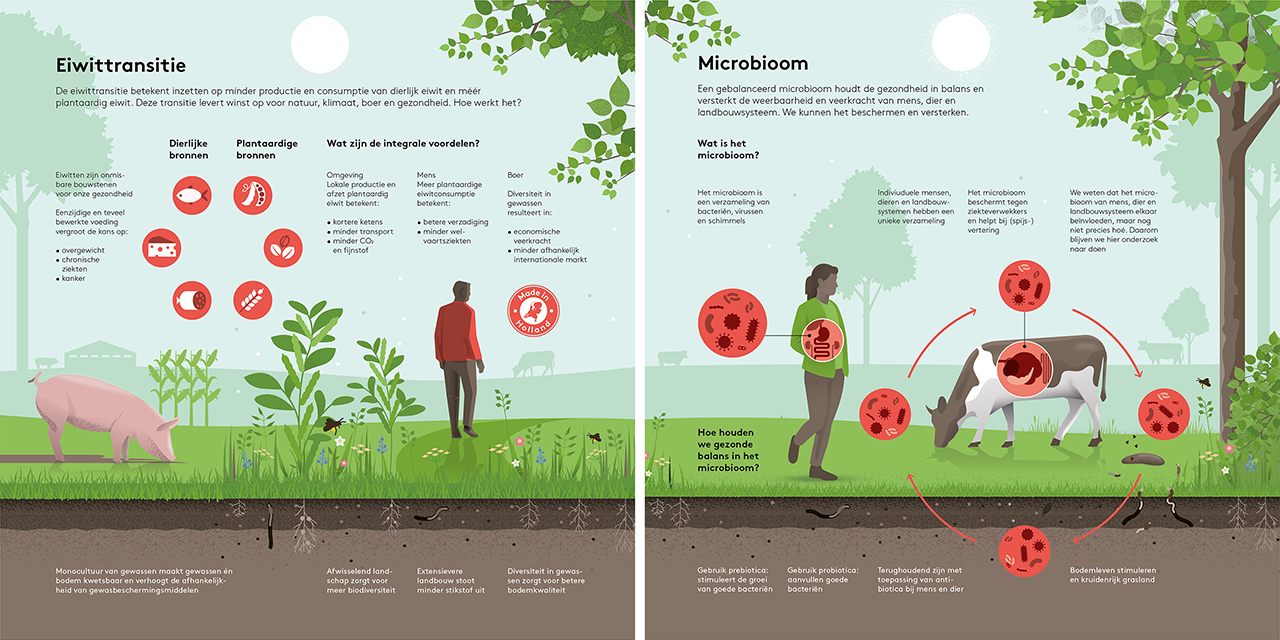
Louis Bolk Instituut Annual report
Concept and art direction: Karin Schwandt Illustration: Jeroen van Ingen
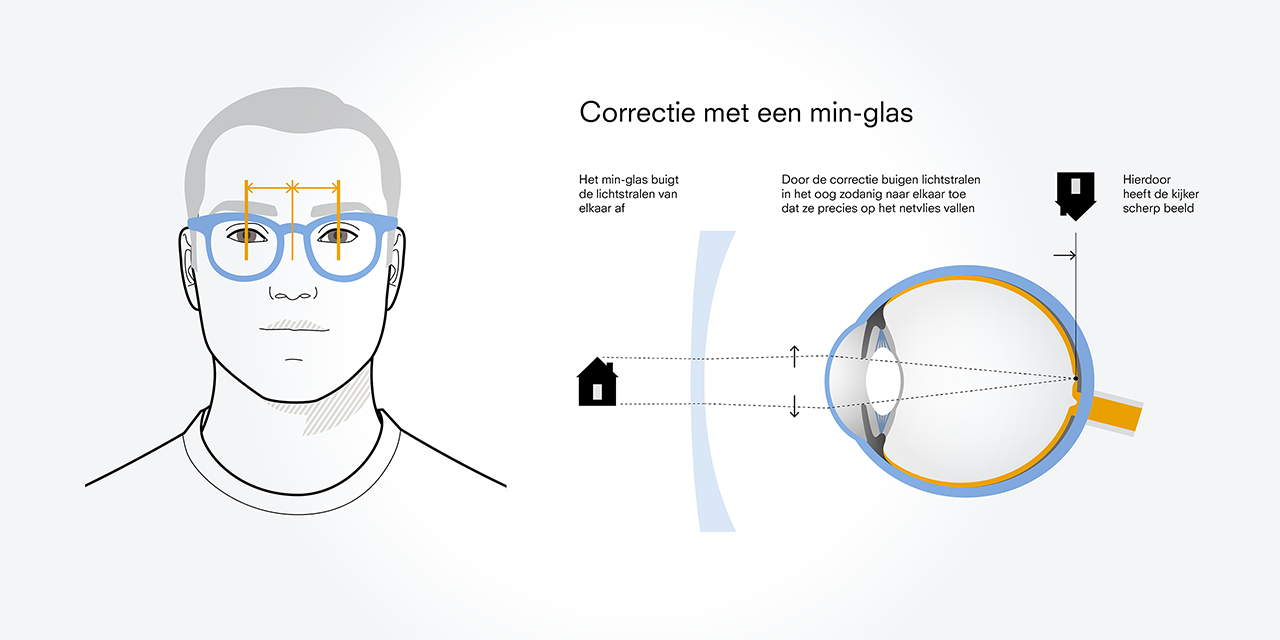
HOYA Anatomy and correction of the eye
Concept and design: Karin Schwandt Illustration: Steffie Padmos
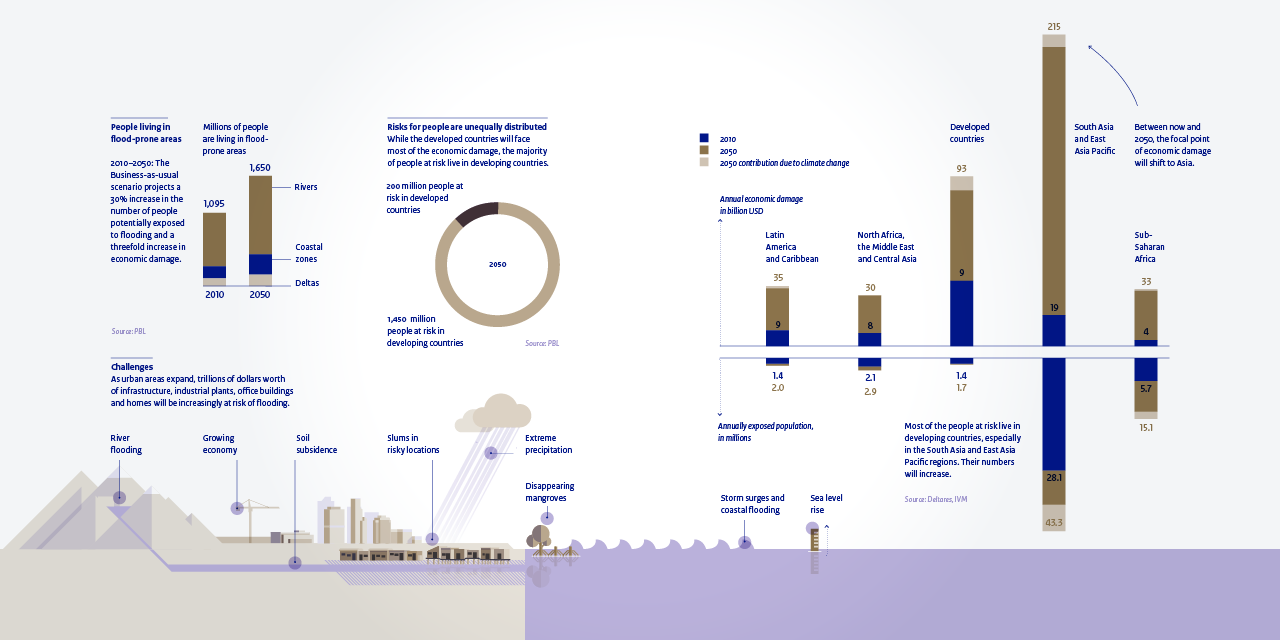
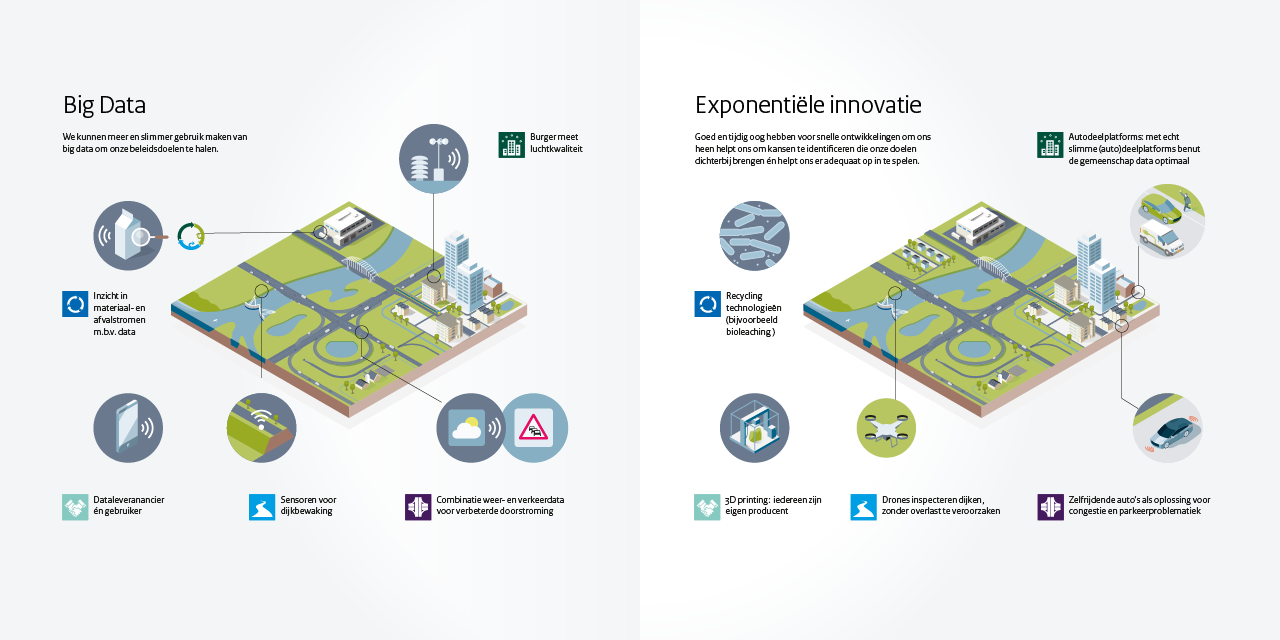
PBL Future Water Challenges
Concept and art direction: Karin Schwandt Illustration: Jeroen van Ingen Graphic design: Suzanne Bakkum
PBL River Basin Delta Tool
Creative direction and design: Karin Schwandt Editor: Wilfried ten Brinke Development: Leukeleu
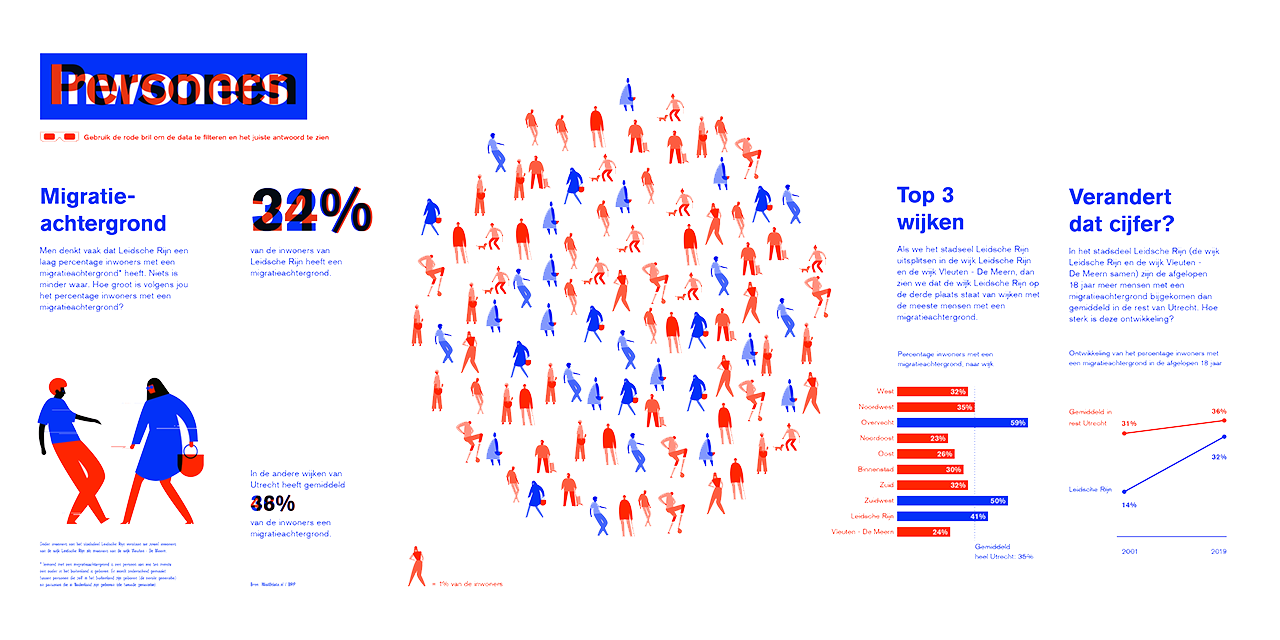
RAUM / CLEVER°FRANKE Cirque du Data
Research and design: Karin Schwandt Illustration: Steffie Padmos
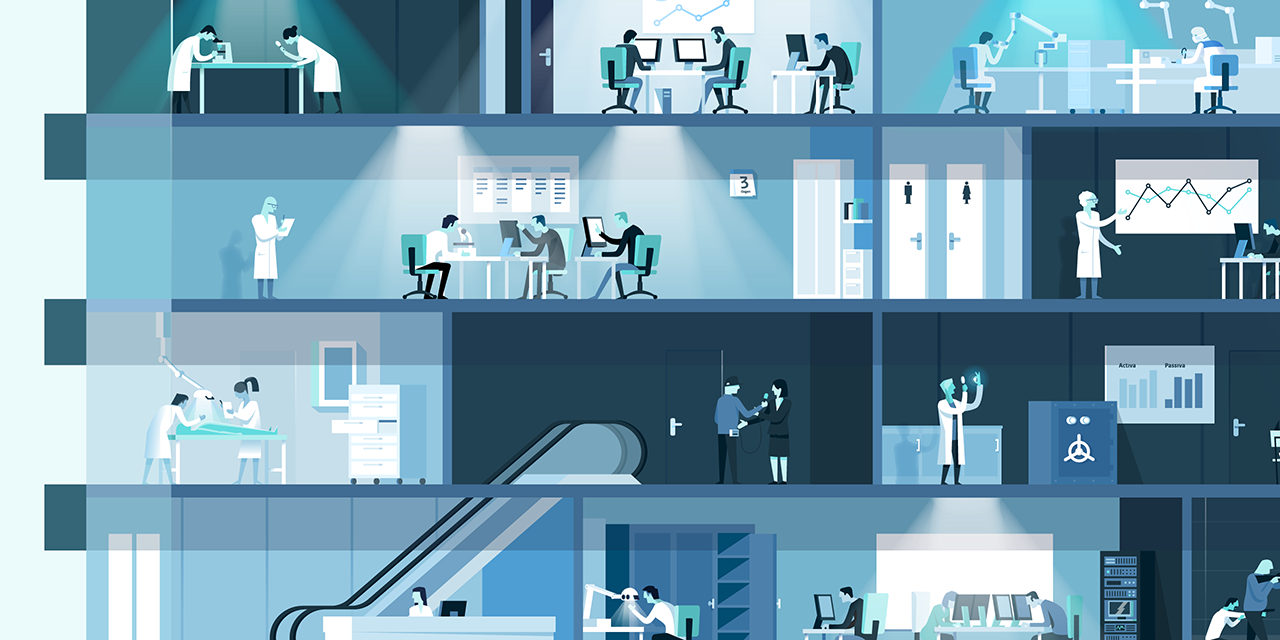
Netherlands Forensic institute Annual report 2014 in interactive infographics
Design and Illustrations: Roel de Jonge and Randy Beker Development: TND
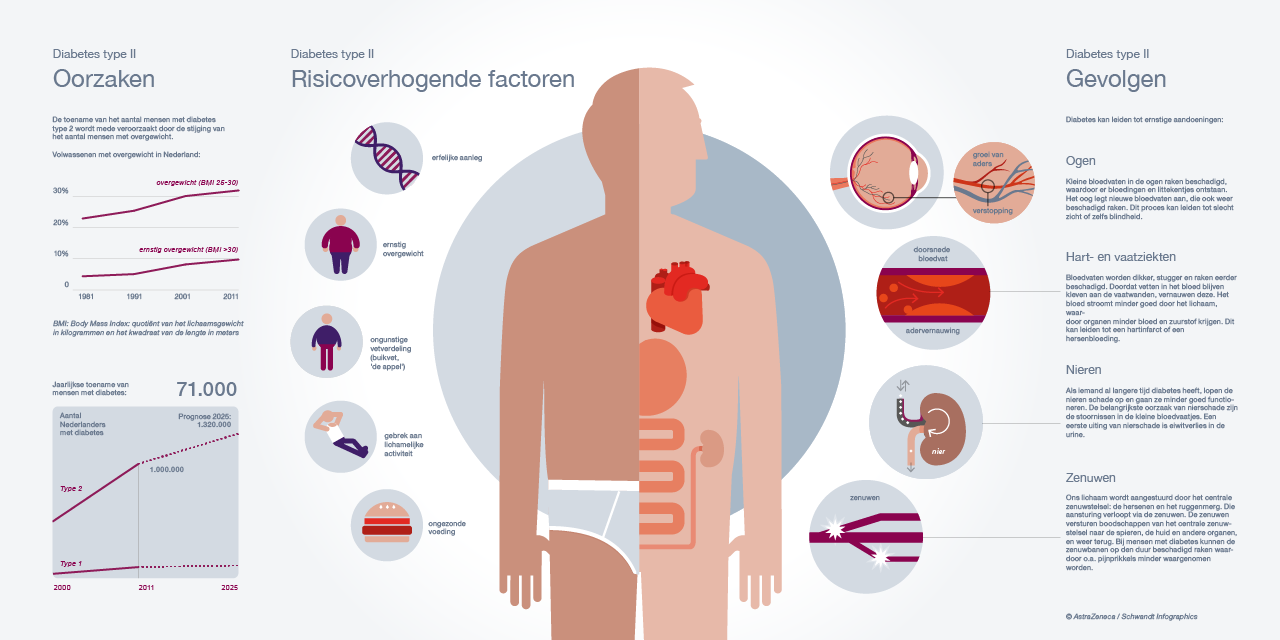
AstraZeneca Series of infographics on causes and symptoms of diabetes type 2
Concept and art direction: Karin Schwandt Research, design and illustration: Steffie Padmos and Leon de Korte
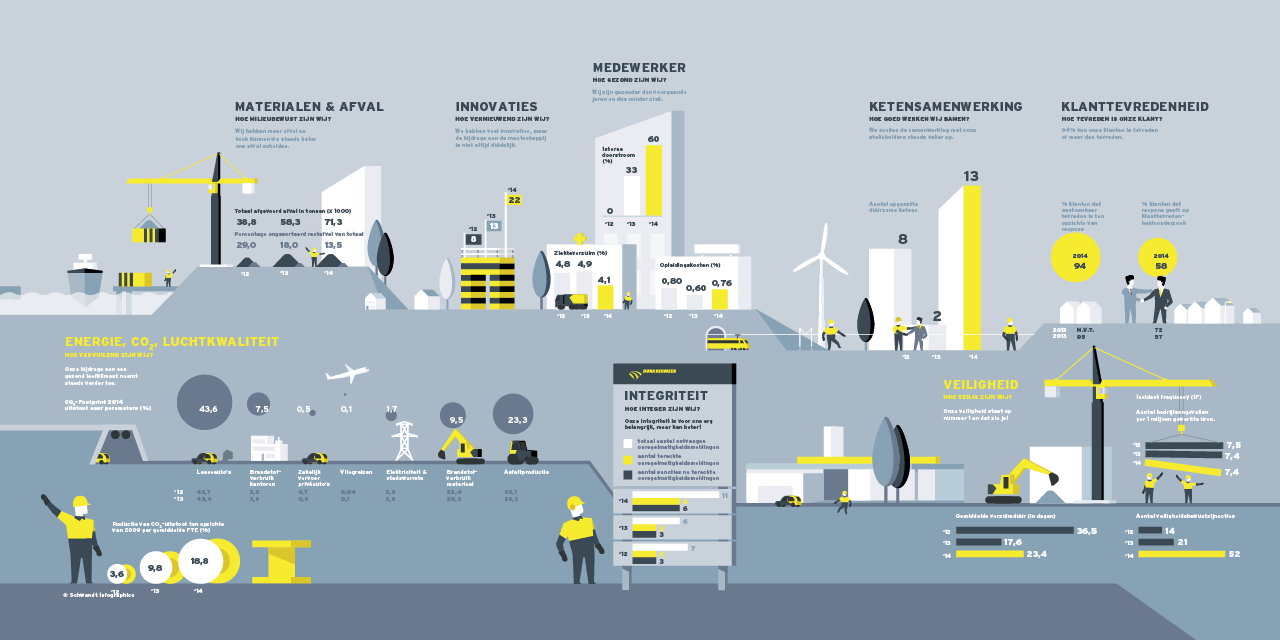
Dura Vermeer Infographic representing key figures for the annual report
Concept and art direction: Karin Schwandt Illustration: Randy Beker
Dutch Ministry of Infrastructure and the Environment Series of infographics on knowledge management
Concept and art direction: Karin Schwandt Illustration: Jeroen van Ingen
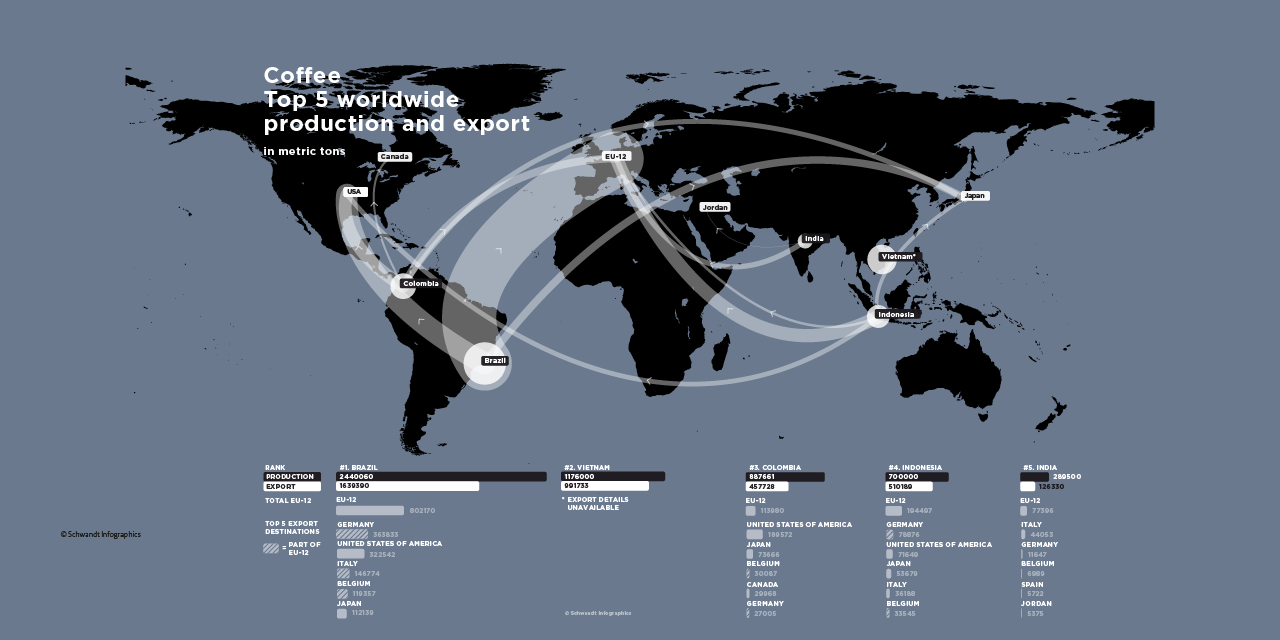
IDH sustainable trade Initiative Data visualization on the production and export of coffee
Concept and design: Roel de Jonge Art Direction: Karin Schwandt
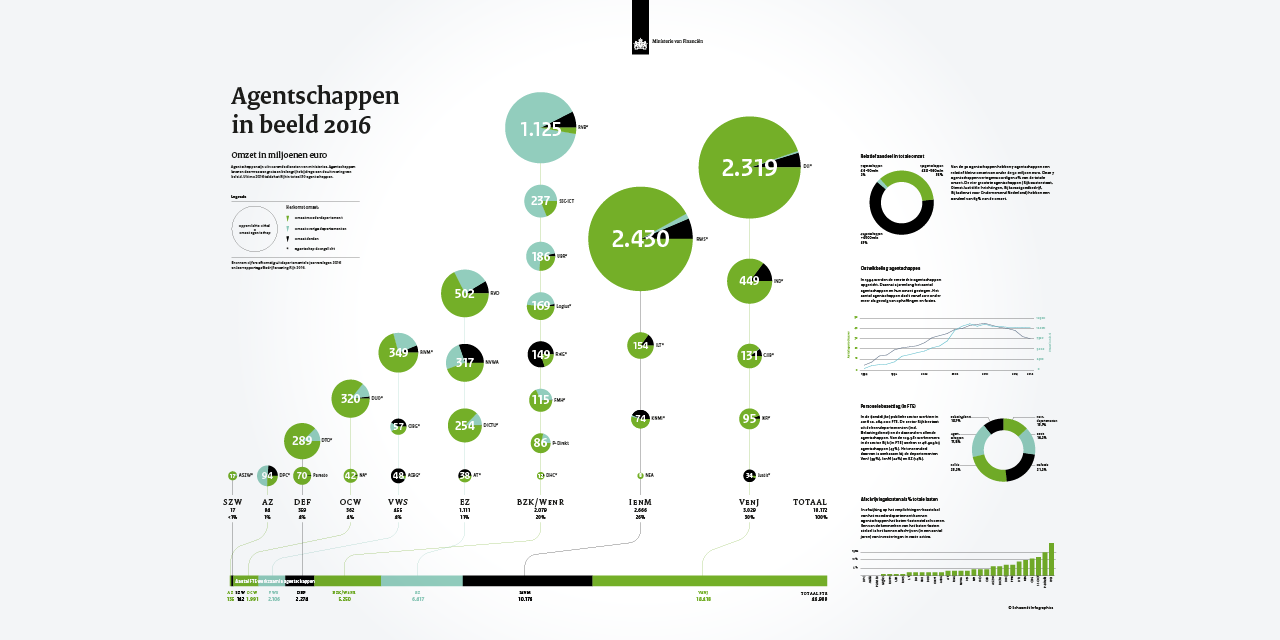
Dutch Ministry of Finance Data visualization on the budget of governmental organizations
Concept and design: Roel de Jonge Art direction: Karin Schwandt
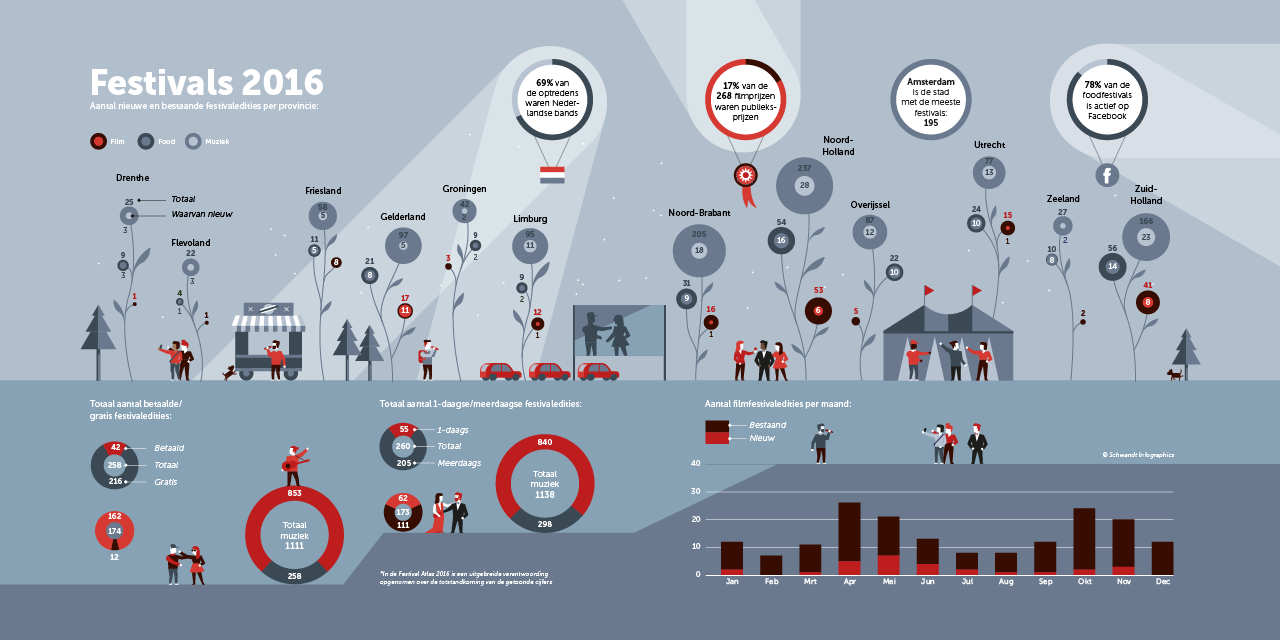
Festival Atlas Infographic representing key figures on festivals in the Netherlands
Concept and design: Karin Schwandt Illustration: Randy Beker
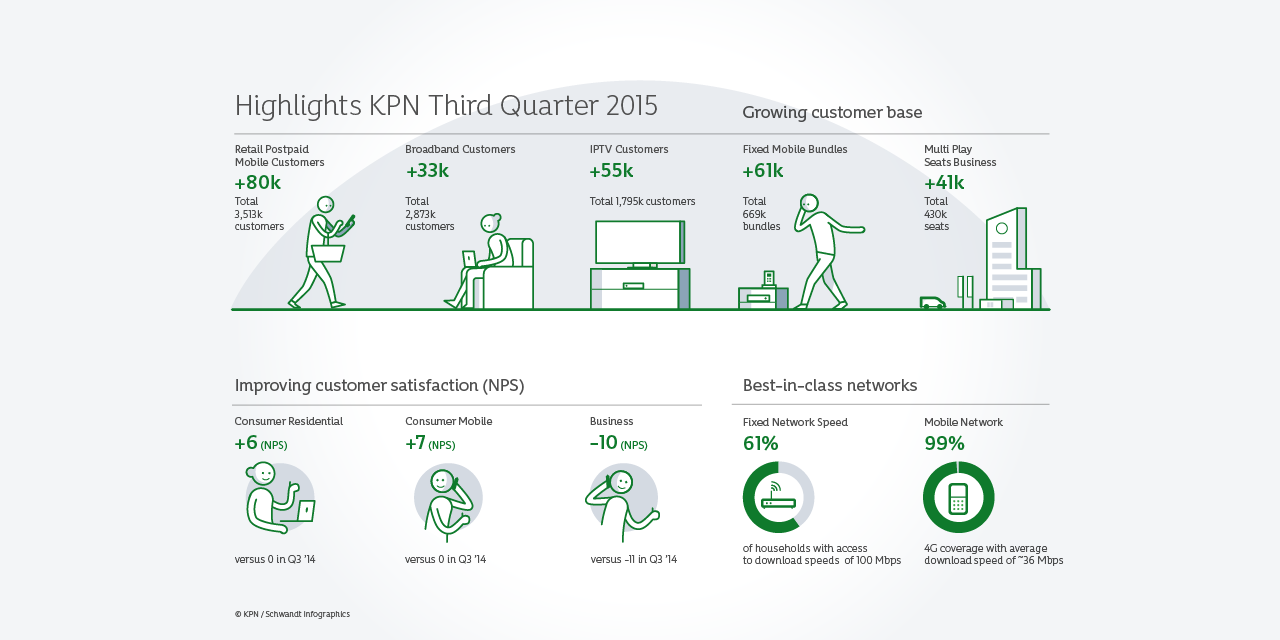
KPN Infographic on quarterly results for investor relations
Concept and art direction: Karin Schwandt Illustration: Randy Beker
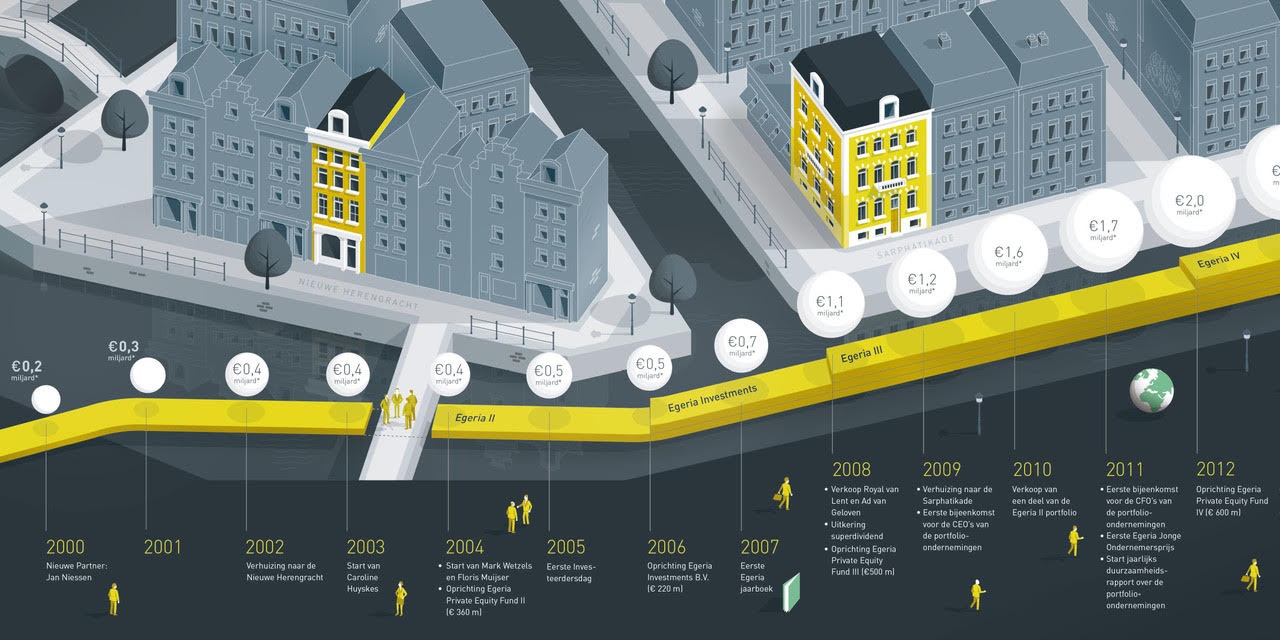
Egeria Infographic showing history and key figures for the annual report
Art direction: Roel de Jonge Design and illustration: Leon de Korte